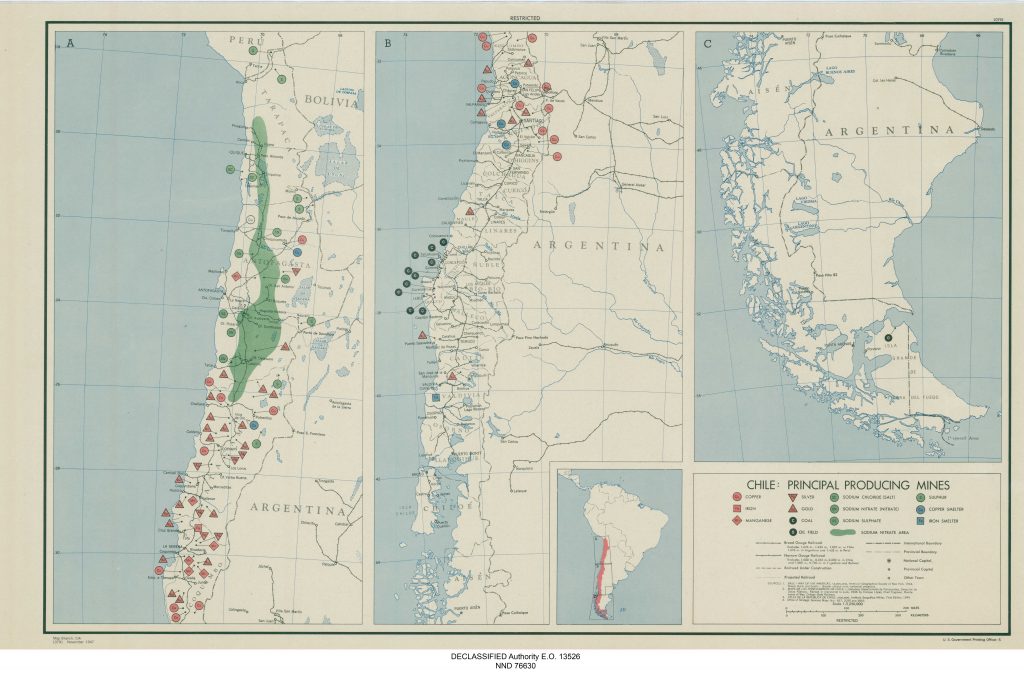
This map was created in November of 1947 by an unknown author, but it is from the Map Branch of the CIA. This means that this map was created for the United States government. It portrays the principal producing mines in Chile, including some of the mines I discuss in my project, such as Chuquicamata and Copiapo. It appears to be focusing primarily on location, as it also includes various railroads, boundaries, capitols, towns, and finally a scale. This contains every mineral Chile produces, but for my project I will just be focusing on the copper and copper smelting mines. I believe the purpose is to provide the U.S. government geographical information about the key producing mines of Chile from that time. To put this map in context, it was about fifty years before Chile’s highest production percent.
This map is a good base to provide context about Chile and their mining success. Although, I am only focusing on copper in my project, it can be interesting to step back and see how Chile was succeeding through all different materials. It also provides to readers a visual on the amount of principle producing mines in 1947, which is vaguely in the middle of the time frame I am discussing. It allows us to understand Chile’s relationship with the United States, as well. Because this map was produced for the U.S., we can assume they were involved in Chile’s mining in some way.

Chiles Principle Producing Mines. Map. Map Branch, CIA. From National Archives, Maps and Charts. https://catalog.archives.gov/id/159081722